Processing sketches: lottery number visualisations
Following on from my previous posts about the nine words we’re using as inspiration, I thought I’d show some of the ideas I’ve been playing with in the third phase of the project, which is using Processing to create images. The images here demonstrate some of the things I really like about Processing, like the way that an idea can be reworked quickly and easily to create images which can be interesting visually and conceptually.
All the images in this post are linked with the single word ‘serendipity’. Inspired by the works of people like Ben Fry and Jer Thorp, who work on large scale data visualisations, I decided to plug in some results from the UK’s National Lottery and see what I could come up with. All the results were taken from this archive.
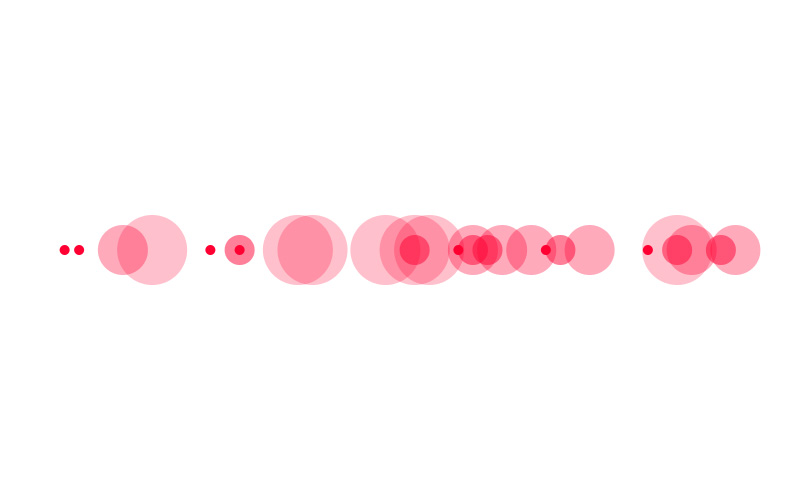
This was the initial sketch, which takes four draws (of seven numbers each) and represents each draw with a differently sized circle. The numbers range from 1 to 49, left to right:
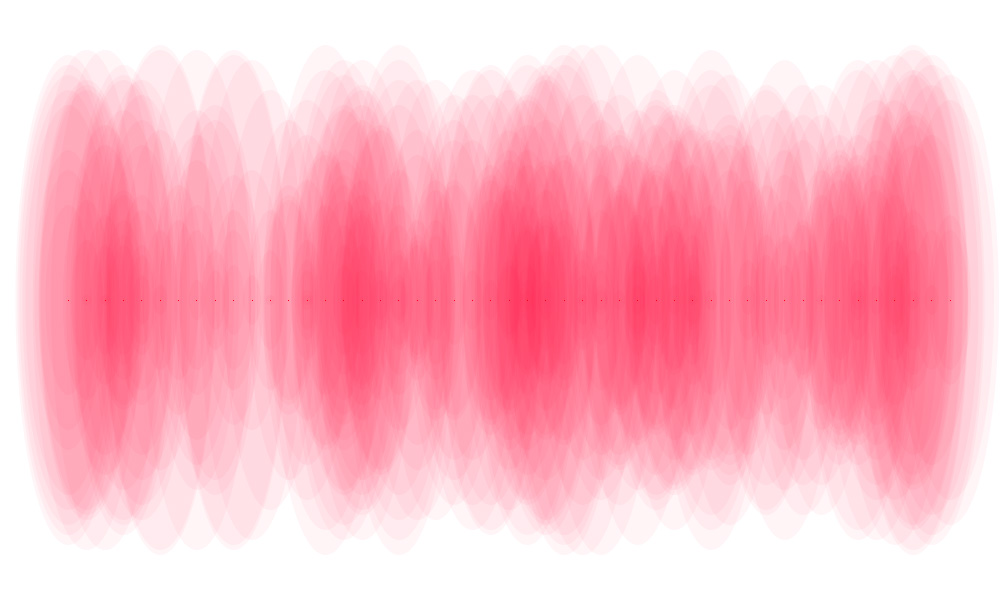
Here’s the second version, which is the same idea stretched over the vertical axis and using 50 draws, instead of just four:
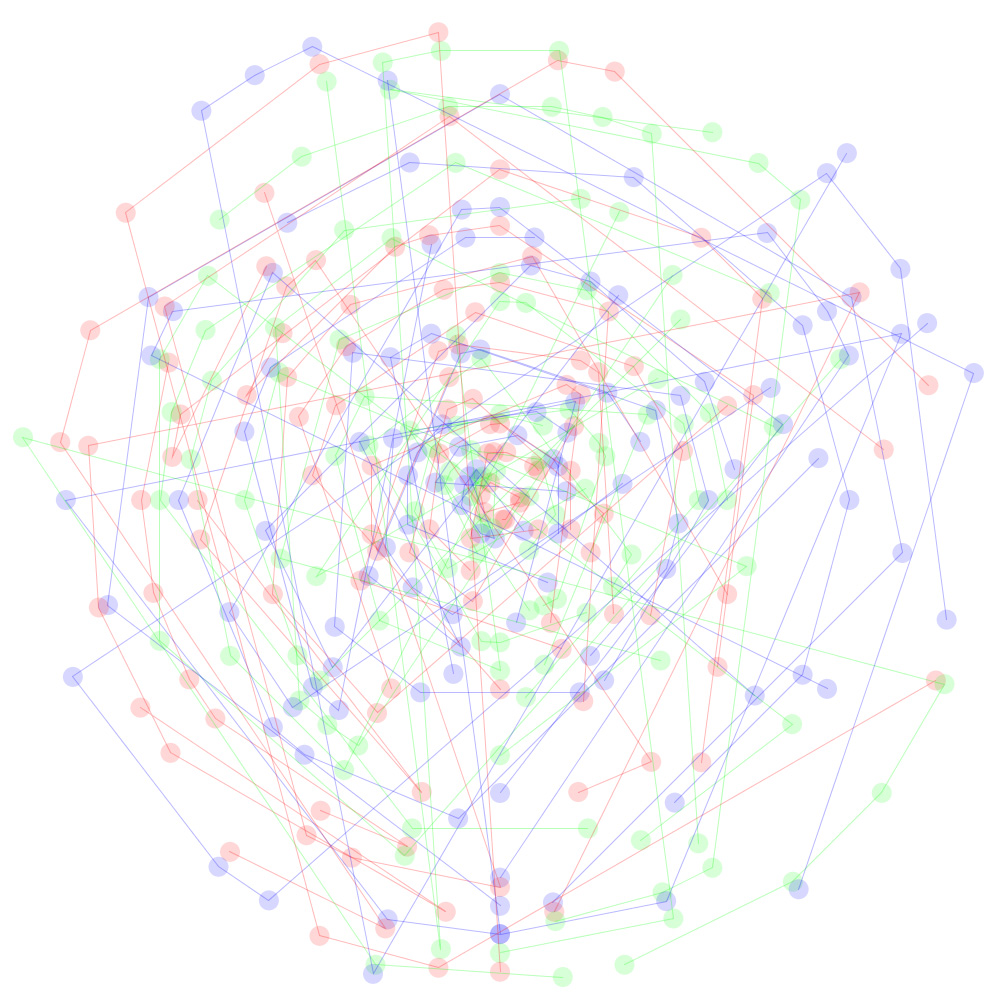
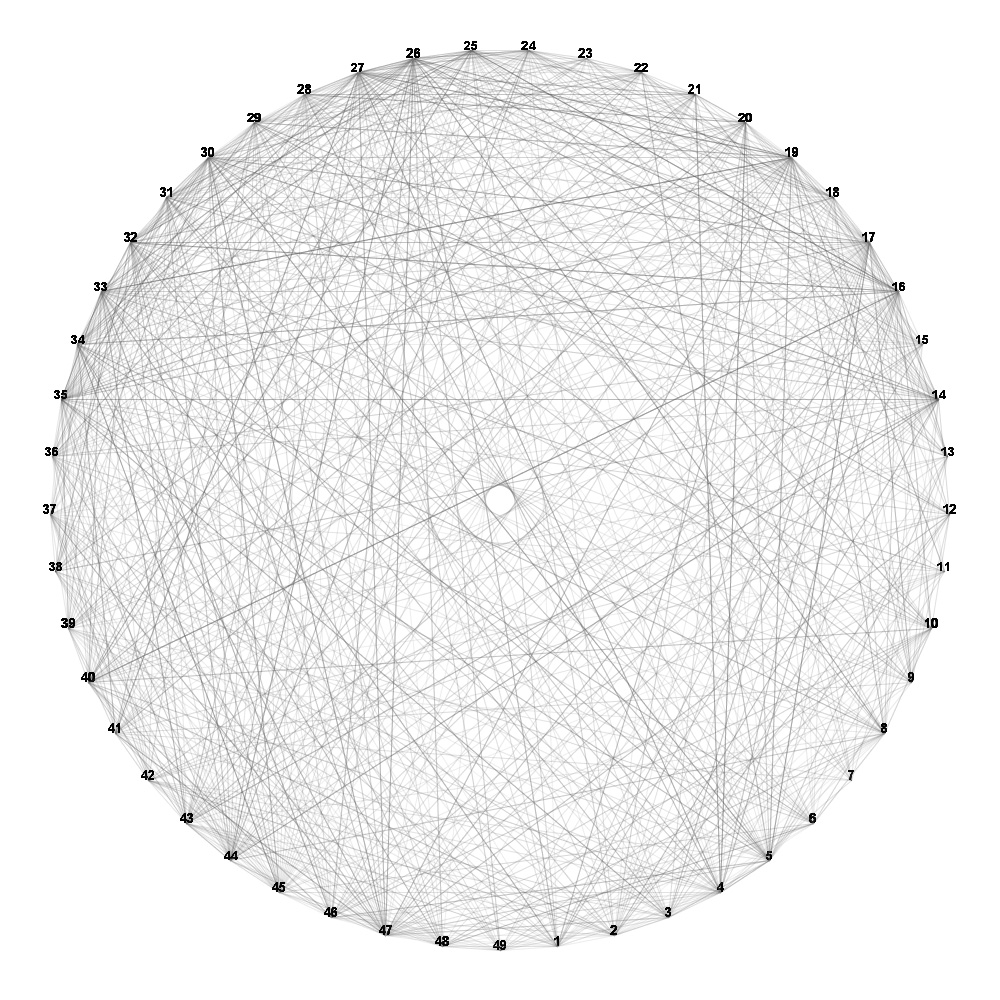
Next, using the same 50 draws, I spread the results out a bit. Here, the numbers 1 to 49 are mapped on a circle; each draw is placed on a separate circle radiating outwards from the centre. Each dot is a number and is connected to the other dots from that draw. I added some basic colour to make it easier to distinguish the different draws. This is the version I’ll probably use as part of the final submission for this project.
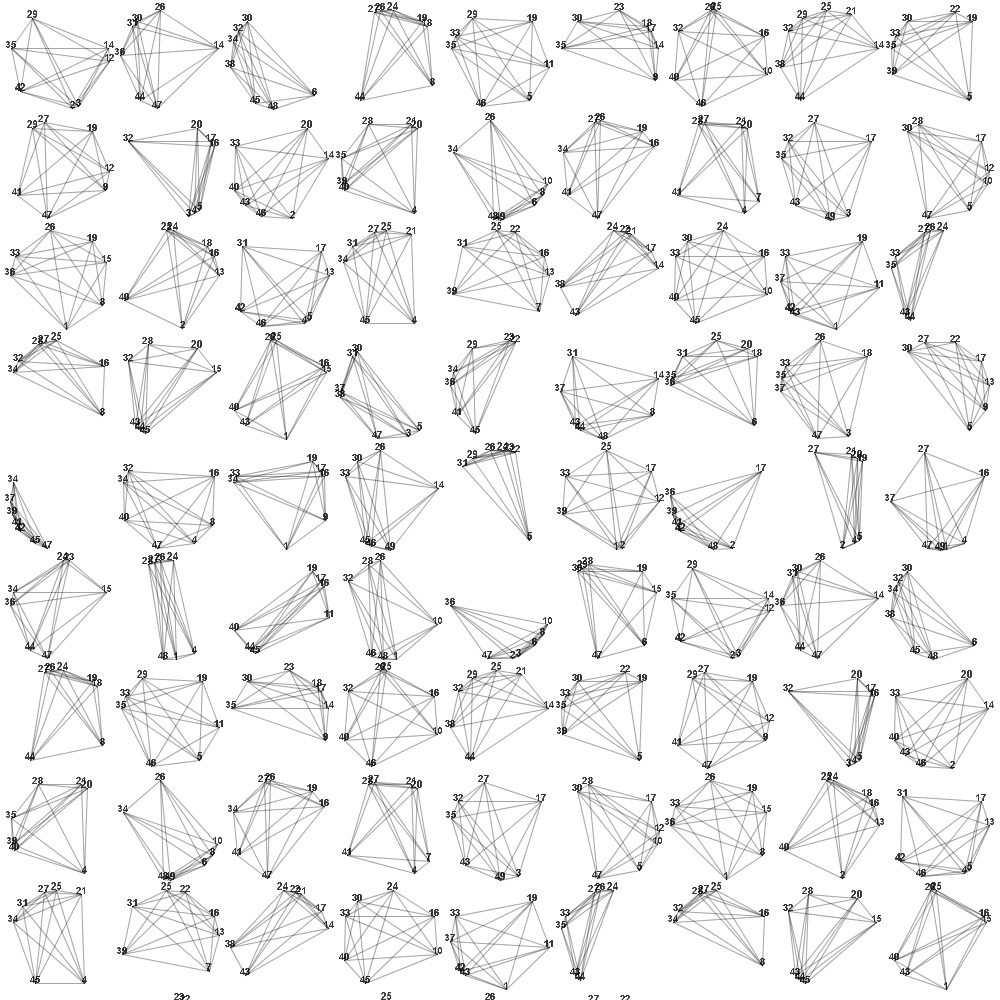
I decided to focus on the shapes the linkages between numbers in each draw form. Here they are individually:
Here they’re laid on top of each other:
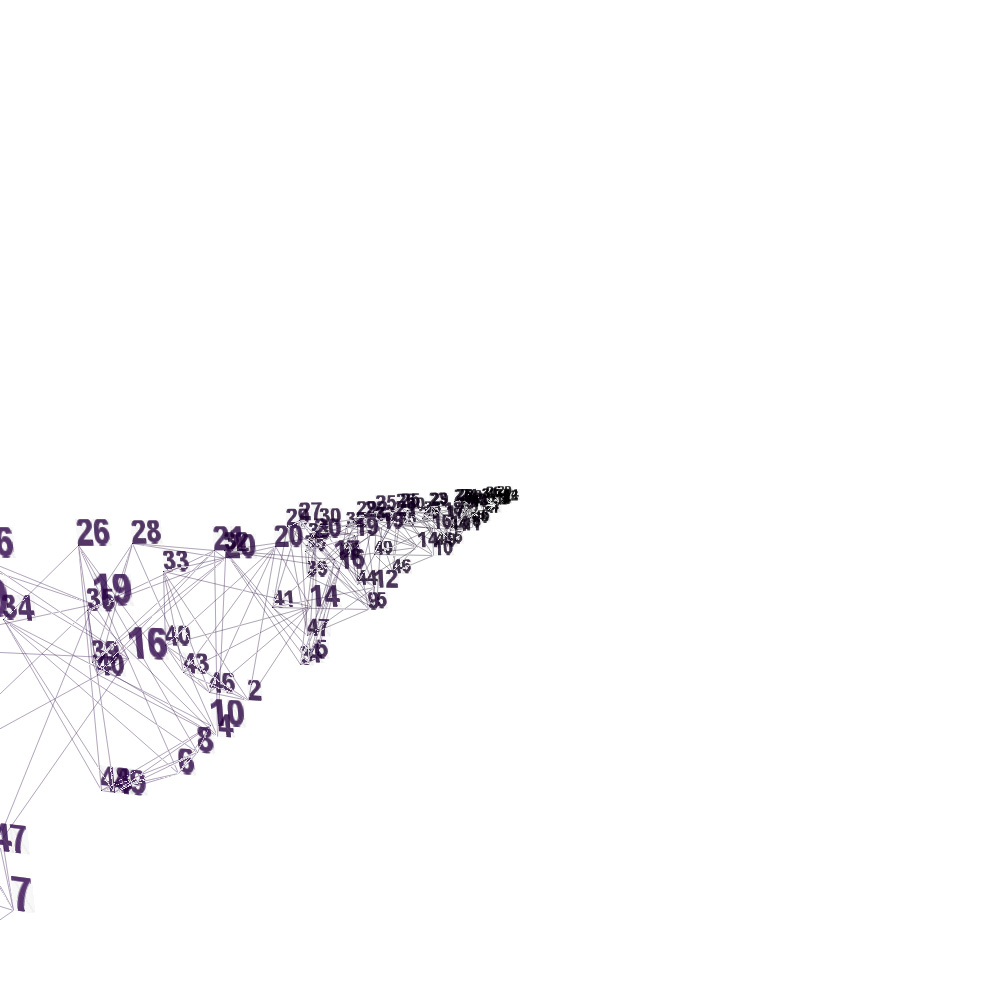
And this is the same concept but rendered in 3d. The Z axis (depth) relates to time:
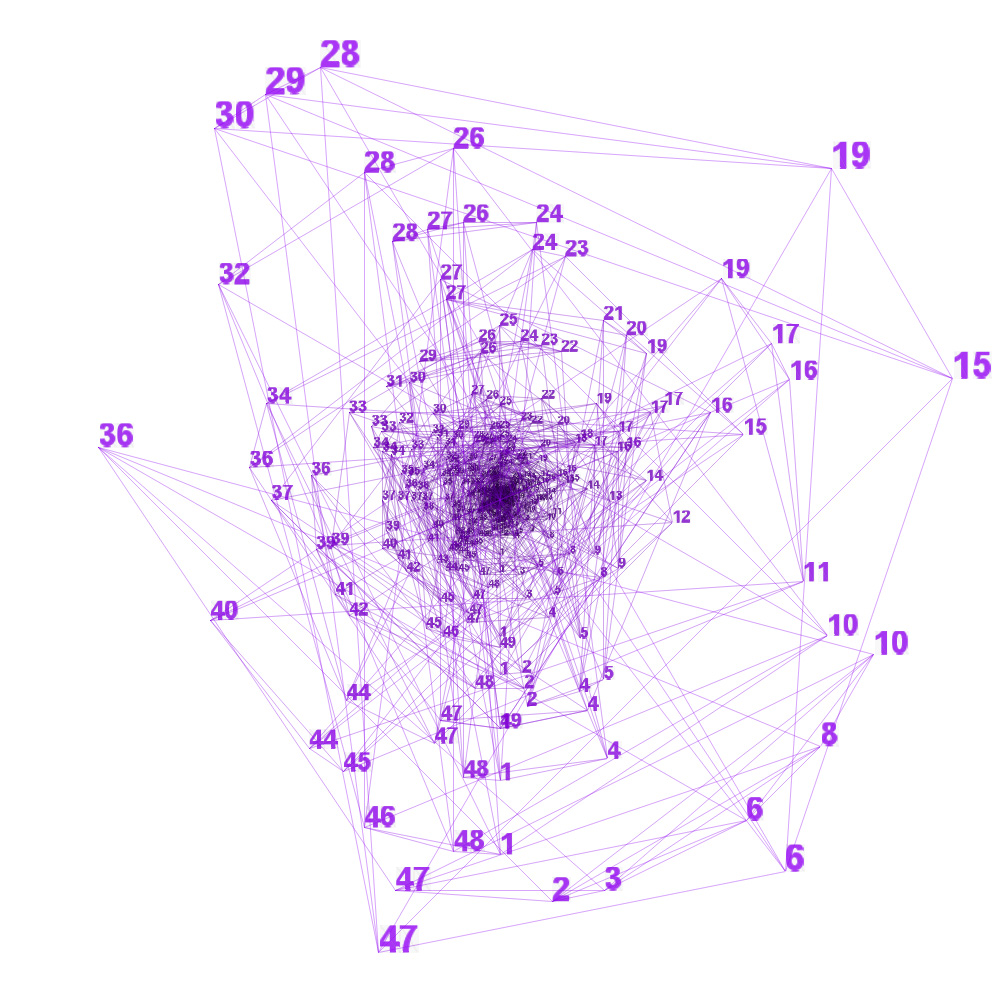
And a second image of that, to give more of a sense of depth:
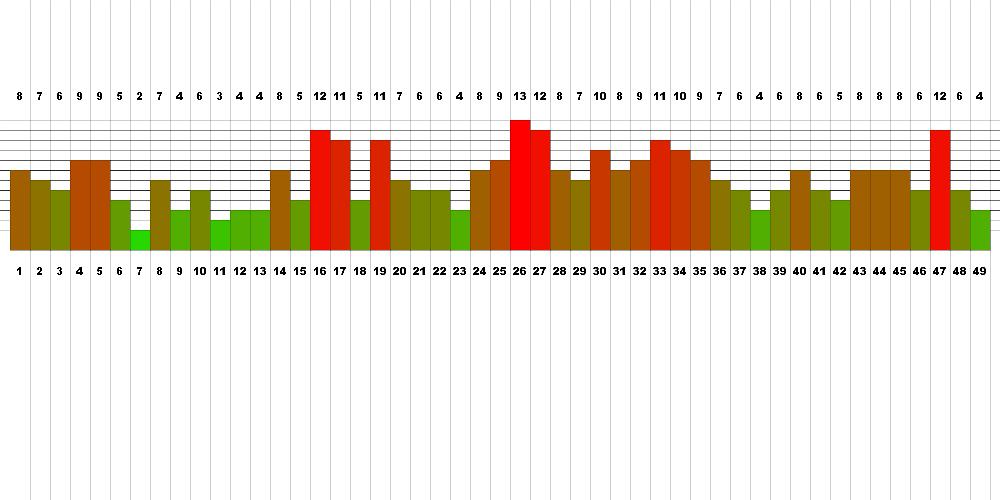
Finally, I’m aware that none of these images are particularly useful in actually analysing the numbers drawn, and deliberately so: I’ve approached this from a visual perspective, rather than a data analysis perspective. Just to show it can be done, though, here’s a straightforward graph of how often each number was drawn in the fifty draws concerned here:
I hope that’s been interesting. I’ll put the code for the final piece up in a later post, once I’ve finalised the other eight images! Enjoy!